
Your air sensor, with a face.
An animated dashboard card for any air-quality sensor you already have in Home Assistant — an IKEA ALPSTUGA, an AirGradient, an Awair, a PurpleAir, an ESPHome build. Link the sensor, and the card's whole scene — sky, hills, and its little mascot's mood — shifts with the air quality, so a glance tells you before you read a number.
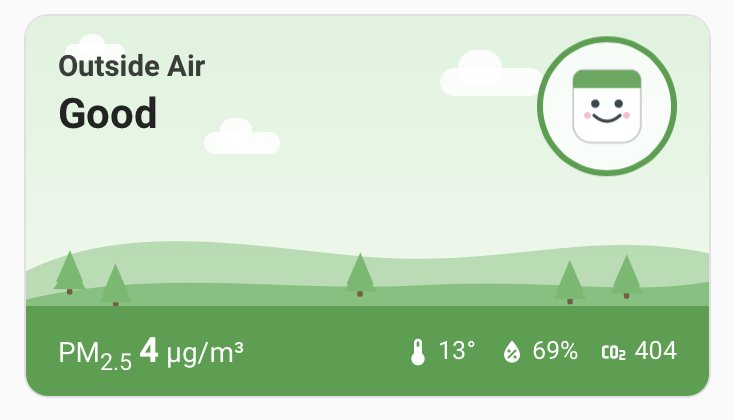
A glanceable scene
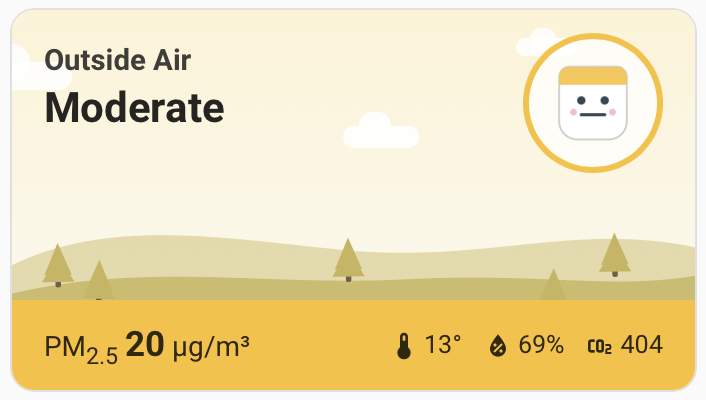
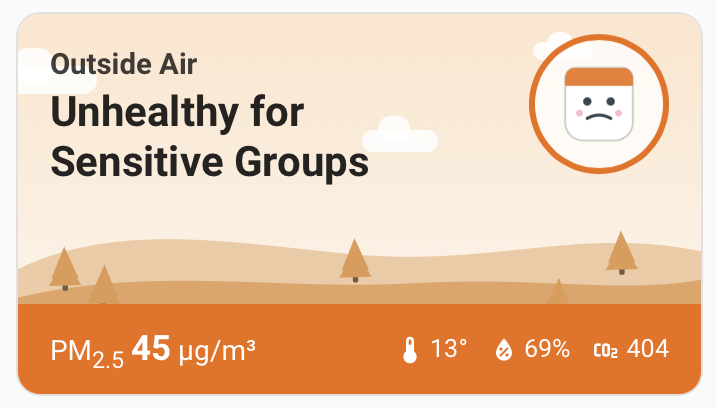
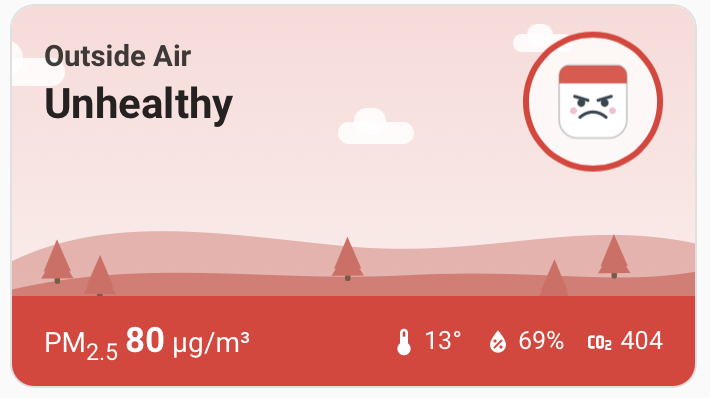
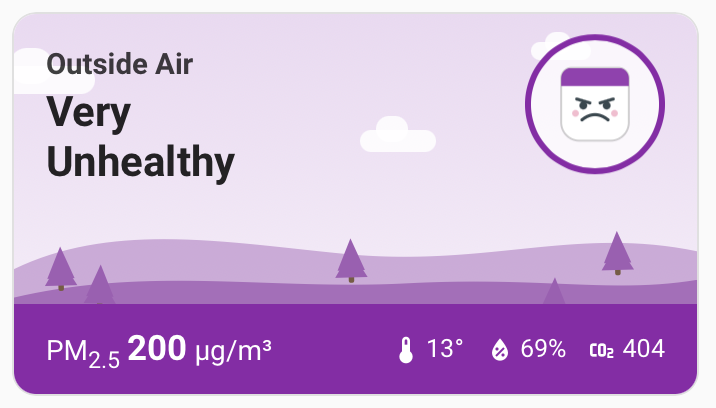
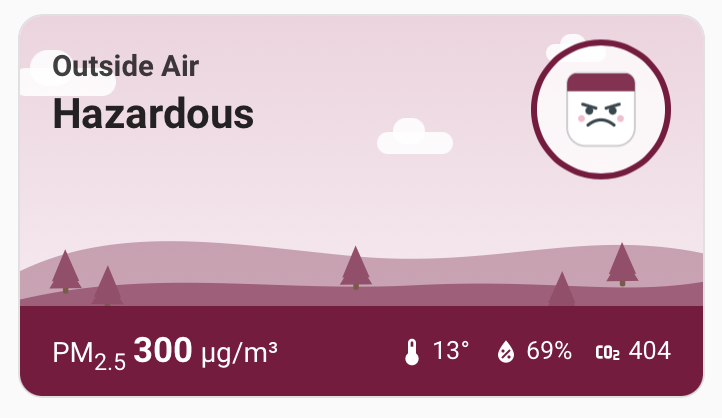
Six moods, from great to get-some-air.
In PM2.5 mode the colours follow the US EPA categories — green and a grin on a good day, a dark frowning scene when it's hazardous. In CO₂ mode the same six moods track ventilation instead: Fresh, Acceptable, Getting Stuffy, Stuffy — Ventilate, Poor, Extreme.
Why it exists
Every air sensor deserves a better card.
Air sensors land in Home Assistant as a pile of entities — a number here, a percentage there. This card started life inside AirGradient Public, but the scene deserved to work with hardware you own too. It's pure dashboard card — no integration, no API, no account. If your sensor exposes a PM2.5 or CO₂ entity, it works.
Any sensor, one option
Pick the PM2.5 or CO₂ entity and you're done. Temperature, humidity and the other pollutant are auto-discovered from the same device.
PM2.5 or CO₂ first
A per-card switch. Lead with particulates and EPA categories, or with CO₂ and ventilation categories for that door-shut office or streaming room.
Charts that build up
A 24-hour graph and a 10-day heatmap from HA's own recorder — plus WHO and cigarette tiles in PM2.5 mode, peak and time-above-1000-ppm in CO₂ mode.
One-click install
Ships as a HACS dashboard card — the resource registers itself, no restart needed, and a full visual editor for setup.
Tap to go deeper
A calm card on the wall, the full story on tap.
The compact card sits quietly on your dashboard. Tap it and it opens into a detail sheet built entirely from Home Assistant's own history — no cloud service involved.
Last 24 hours, hour by hour
A colour-coded chart, plus rolling 12-hour and 24-hour averages.
Put in perspective
PM2.5 mode: how far over the WHO annual guideline you sit, and the same pollution as cigarettes smoked. CO₂ mode: the day's peak, and how long the room spent above 1000 ppm.
Ten days at a glance
A by-the-hour heatmap of the last ten days, so patterns — stuffy afternoons, wood-smoke evenings — jump out.
Up and running in a couple of minutes
Open in HACS
Click the button below — Home Assistant opens with this repository pre-filled as a Dashboard repo — then Download. No restart: dashboard cards load straight away.
Add the card
Add "Air Quality Scene Card" from the dashboard card picker. (Hard-refresh the browser once so it loads.)
Link your sensor
Pick PM2.5 or CO₂ as the primary reading and choose the entity in the visual editor — everything else is auto-discovered.
Common questions
Which air quality sensors work with the Air Quality Scene Card?
Any sensor that exposes a PM2.5 or CO₂ entity in Home Assistant — an IKEA ALPSTUGA, an AirGradient monitor, an Awair, a PurpleAir, an ESPHome build, or anything else. Pick the entity in the visual editor and temperature, humidity and the other pollutant are auto-discovered from the same device.
Do I need an account, API key or cloud service?
No. It's a pure dashboard card. It reads your existing Home Assistant entities and draws its charts from Home Assistant's own recorder — no integration, no API, no account, and nothing leaves your network.
How do I install the card?
Through HACS as a Dashboard repository: open the repo via the My Home Assistant button, click Download, then add "Air Quality Scene Card" from the dashboard card picker. No restart is needed — dashboard cards load straight away.
Can it show CO₂ instead of PM2.5?
Yes. Each card has a mode switch: lead with PM2.5 and US EPA categories, or with CO₂ and ventilation categories (Fresh through Extreme) — handy for a door-shut office or streaming room.
Is the Air Quality Scene Card free?
Yes — free and open source under the MIT license.
What's the difference between this and AirGradient Public?
Air Quality Scene Card works with sensors you own in Home Assistant. AirGradient Public is a separate integration + card that follows any public sensor on the AirGradient map — no hardware needed. You can run both.
How to add air quality to your Home Assistant dashboard →The 5 best Home Assistant air quality cards →
Give your air sensor the card it deserves.
Free and open source. Installs through HACS in one click — no restart.