1. Air Quality Scene Card: best for glanceability
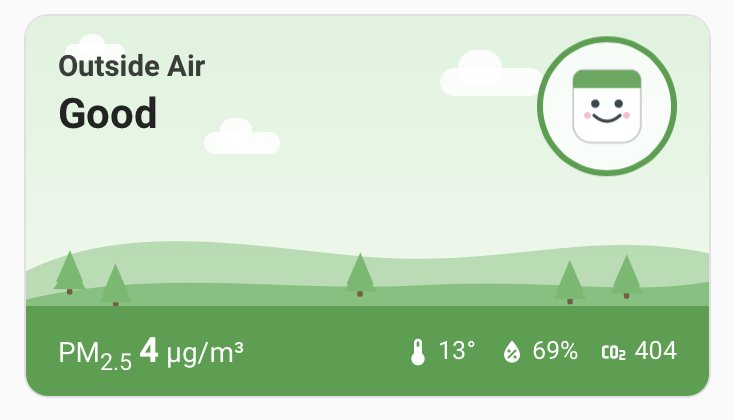
Air Quality Scene Card (yes, mine) renders your sensor as an animated scene whose sky, hills and little mascot’s mood follow the air quality: green and grinning on a good day, dark and frowning when it’s hazardous. Colours track the US EPA PM2.5 categories, or six ventilation categories in CO₂ mode. Tapping opens a detail sheet built from Home Assistant’s own recorder: a 24-hour chart, a 10-day heatmap, WHO-guideline and cigarette-equivalent tiles.
- Works with: any PM2.5 or CO₂ entity, including IKEA ALPSTUGA, AirGradient, Awair, PurpleAir and ESPHome builds. Temperature, humidity and the other pollutant auto-discover from the same device.
- Install: HACS dashboard repo, no restart, full visual editor.
- Best for: wall tablets and family dashboards, where anyone in the house reads it without knowing what a µg/m³ is.
- Skip if: you want dense numbers over interpretation. See the next two.
2. Air Quality Card by KadenThomp36: best for multi-pollutant detail
This card takes the opposite approach: one panel for everything your monitor measures. It supports entities for CO₂, PM2.5, PM10, PM4, PM1, PM0.3, CO, radon, formaldehyde, tVOC, NOx, humidity, temperature and pressure, scored against WHO-based thresholds with gradient graphs. Its compact and expandable display modes are a standout: a small overall-status badge that expands to the full card when tapped.
- Best for: serious monitors (AirGradient, Apollo, custom ESPHome arrays) where you want every pollutant scored in one place.
- Skip if: you have a single-value sensor. The density is wasted on one number.
3. Air Quality Card by UrbanTechIO: best simple bar overview
UrbanTechIO’s card (inspired by Olen’s Flower Card) visualises pollutants as intuitive colour-coded bars: CO₂, VOCs and PM2.5 alongside temperature and humidity, with customisable thresholds. It’s deliberately simple: each reading is a labelled bar that’s green, amber or red. Installs via HACS.
- Best for: a clean, compact multi-sensor row without graphs or animation.
- Skip if: you want history. It’s a now-view, not a trend view.
4. Air Visual Card: best for city-level AQI
The Air Visual Card reproduces the familiar AirVisual-style AQI tile (big number, category colour, weather icon) using data from the AirVisual or World Air Quality Index (WAQI) integrations. No hardware involved: it’s your city’s official monitoring stations on your dashboard.
- Best for: outdoor AQI when you don’t own any sensor and a nearby station is good enough.
- Skip if: you want hyper-local readings. For that, a public AirGradient map sensor down your street beats a station across town.
5. Mini Graph Card: best for trends
It isn’t an air quality card at all. Mini Graph Card is one of the most-installed HACS frontend cards ever, and a PM2.5 or CO₂ entity with color_thresholds set to the EPA breakpoints makes a beautiful, compact trend line that shifts colour as the air worsens. Pairs well with any card above: interpretation up top, trend below.
- Best for: spotting the pattern, whether that’s the cooking spike, the wood-smoke evening or the slow CO₂ climb behind a shut door.
- Skip if: you’d have to explain the chart to your family. Pair it with a categorical card instead.
Side-by-side comparison
| Card | Style | Data source | History | Best for |
|---|---|---|---|---|
| Air Quality Scene Card | Animated scene, EPA colours | Any PM2.5/CO₂ entity | 24h chart + 10-day heatmap | Glanceable family dashboards |
| Air Quality Card (KadenThomp36) | Multi-pollutant panel, WHO thresholds | Any supported entities | Gradient graphs | Data-dense monitoring |
| Air Quality Card (UrbanTechIO) | Colour-coded bars | Any supported entities | None | Simple compact overview |
| Air Visual Card | AQI tile | AirVisual / WAQI integrations | None | City-level outdoor AQI |
| Mini Graph Card | Trend line with thresholds | Any numeric entity | Built-in graph | Trends and patterns |
How to choose
Ask who’s reading the dashboard. If the answer is “everyone in the house,” pick a card that interprets: the Scene Card or the AQI tile. If it’s “me, and I want the details,” KadenThomp36’s panel or UrbanTechIO’s bars. And nearly every dashboard benefits from a Mini Graph trend line underneath whichever you choose.
New to all of this? Start with how to add air quality to your Home Assistant dashboard. It covers getting the data in before the cards.
Frequently asked questions
What's the easiest air quality card to install in Home Assistant?
Any card distributed through HACS as a dashboard resource installs in one or two clicks. Dashboard-only cards (like the Air Quality Scene Card or Mini Graph Card) don't even need a Home Assistant restart. Download, add the card, done.
Do these cards work with any sensor?
Mostly yes. All five work with standard Home Assistant sensor entities. The exception is the Air Visual Card, which is built around AQI data from the AirVisual or World Air Quality Index integrations rather than a raw PM2.5 sensor you own.
Do I need a custom card at all?
No. Home Assistant's built-in Gauge and History cards display air quality fine. What a custom card adds is interpretation: category colours, thresholds, history heatmaps and layouts designed for at-a-glance reading.